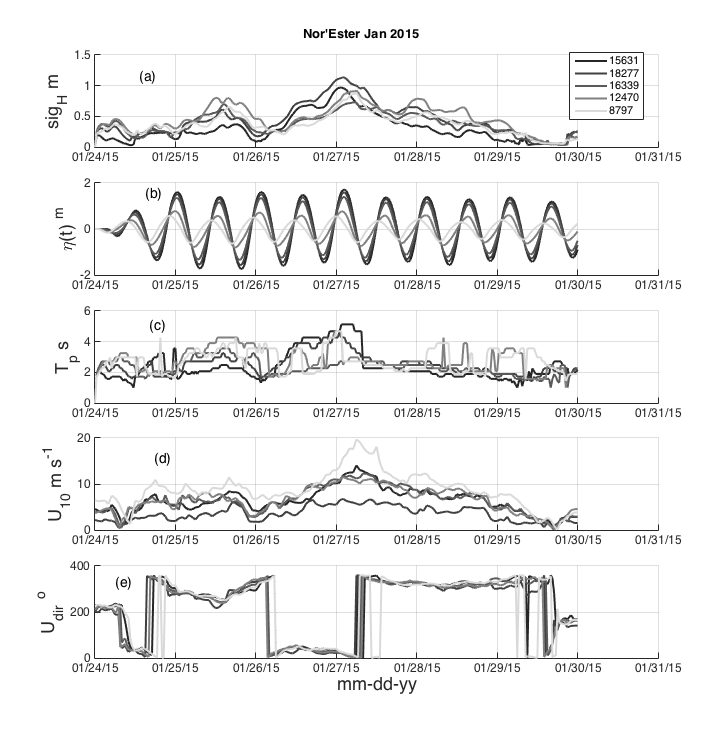
Model response (output) to the Nor’easter of 2015. Each line represents a wave point (15631, 18277, 16339, 12470, 8797), listed from west to east along the Connecticut coast. The wave points are shown as red squares in the map viewer.
Figure a: Significant wave height in meters
Figure b: Sea surface displacement (includes tides)
Figure c: Dominant wave period in seconds
Figure d: Wind speed magnitude (at a 10 m reference height)
Figure e: Wind direction (meteorological convention: wind coming from)