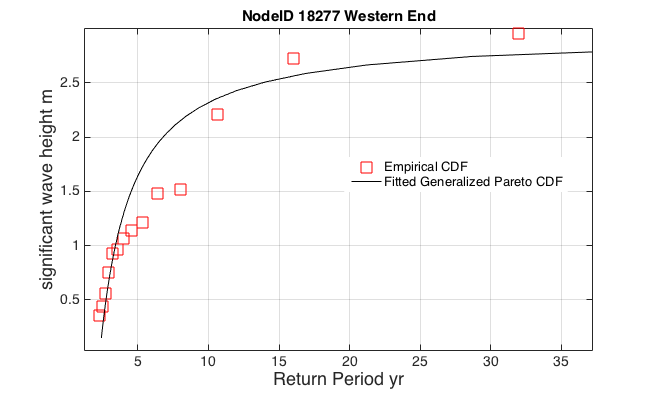
Latitude: 41.106
Longitude: -73.262
Depth: 14.292 m
| Storm | Date | % U max [m s^-1] | %U mean [m s^-1] | % U dir max | % U dir mean | % z(t) max [m] | % sigH maz [m] | % Tpeak max [s] |
| Gloria | Sept. 20, 1985 | 38.109 | 6.416 | 72.484 | 171.006 | 1.67 | 8.223 | 8.835 |
| Sandy | Oct. 25, 2012 | 16.275 | 4.955 | 99.273 | 86.192 | 1.875 | 3.399 | 6.729 |
| NorEaster | Oct. 30, 2012 | 13.766 | 4.493 | 337.885 | 136.945 | 1.68 | 2.314 | 6.145 |
| 1985 | month 9 | 13.375 | 5.356 | 70 | 152.73 | 1.524 | 1.255 | 4.68 |
| 2005 | month 9 | 4.964 | 2.311 | 181.8 | 212.962 | 1.619 | 0.788 | 3.903 |
| 2007 | month 4 | 11.614 | 5.497 | 293.2 | 230.957 | 1.922 | 1.014 | 4.274 |
| 2008 | month 8 | 8.48 | 2.825 | 327.526 | 232.531 | 1.516 | 1.593 | 5.125 |
| 2009 | month 8 | 4.739 | 1.83 | 177.414 | 174.903 | 1.728 | 0.466 | 2.714 |
| 2010 | month 9 | 7.252 | 2.763 | 266.496 | 222.723 | 1.734 | 0.372 | 2.479 |
| 2011 | month 8 | 9.509 | 3.882 | 68.428 | 166.829 | 1.758 | 2.859 | 6.729 |
| 2011 | month 10 | 5.504 | 2.169 | 349.37 | 155.649 | 1.642 | 0.979 | 3.903 |
| 2012 | month 10 | 16.275 | 4.955 | 99.273 | 86.192 | 1.712 | 3.104 | 6.729 |
| 2013 | month 2 | 5.685 | 3.718 | 21.428 | 213.134 | 1.494 | 1.115 | 4.68 |
| 2015 | month 1 | 6.785 | 3.551 | 17.964 | 221.395 | 1.669 | 1.193 | 4.274 |
| 2016 | month 1 | 9.752 | 5.91 | 50.51 | 62.529 | 0.559 | 1.276 | 5.125 |
Attribute Descriptions
| % U max [m s^-1] | maximum wind speed at that point |
| %U mean [m s^-1] | mean wind speed (average over time) |
| % U dir max | maximum wind direction |
| % U dir mean | mean wind direction |
| % z(t) max [m] | maximum sea-surface displacement … storm surge + tides |
| % sigH max [m] | maximum significant wave height |
| % Tpeak max [s] | maximum dominant wave period |

