The University of Connecticut Department of Marine Sciences, in collaboration with the Connecticut Institute for Resilience and Climate Adaptation (CIRCA) and the Department of Civil and Environmental Engineering, implemented a numerical model to resolve the ocean dynamics of the Long Island Sound (LIS) Estuary.
Background
The goal of the research was to numerically resolve sea dynamics (such as currents, waves, sea surface displacement) at the Connecticut coastline.
Purpose: The estuarine circulation of the LIS mediates key biogeochemical cycles (cycles in which chemical elements and simple substances are transferred between living systems and the environment) in the region upon which local environments depend. Understanding local changes in the wave field and circulation dynamics in the LIS goes beyond purely scientific endeavors, with future implications that effect coastal communities and the natural environments. Currently, there is particular attention being placed into evaluating the risk of flooding at coastal areas as the upcoming and present challenges of climate change at a regional scale become apparent with changes in sea level and storm frequency and intensity. This work will help coastal communities better understand the effect of waves at the coastline – where people live, work, and play.
The model: In order to explore the LIS circulation and the wave dynamics at the coastal area, the team used a numerical hydrodynamic- wave coupled model. The model corresponds to the Finite Volume Community Ocean Model (FVCOM) and uses a 3-D unstructured grid-free surface and primitive equations to calculate the hydrodynamics. The model combines the circulation model with a wave module as well as radiation stresses, the bottom boundary layer, and surface stress. To our knowledge this is the first effort to implement and validate a fully coupled high-resolution hydrodynamic- wave coupled model in LIS. Read more about the model here.
Modeled Storm Events
We have modeled a set of storms that have affected the region in recent years – Hurricane Gloria, Super Storm Sandy, Hurricane Irene (2011), Nor’easter of 2015, and several strong Nor’easters. Focusing on key wave statistics such as the significant wave height (sigH m) and the dominant wave period (T s).
There are two NOAA buoys in LIS (Central LIS (CLIS) and Western LIS (WLIS)) that continually collect all sorts of information, though they are located relatively far from shore. We hypothesized that the wave statistics at the five study points, distributed across Connecticut at the coastline, would have different coastal responses than observations at the CLIS and WLIS buoys.
Model Results Summary
The model is able to resolve coastal scales and capture key wave statistics in shallow waters. The response of the system to different storms shows significant differences along the coastline (west to east). For example, during the past two most severe events (Sandy and Irene) waves were longer and showed larger amplitudes at the Eastern end, whereas the Western end shows shorter and less severe waves reaching the coast. Though, this is not the case for all modeled events (e.g. Nor’easter 2015). Generally speaking, very severe events will exhibit this behavior, whereas more common storms will exhibit a more heterogeneous coastal behavior.
Relevance
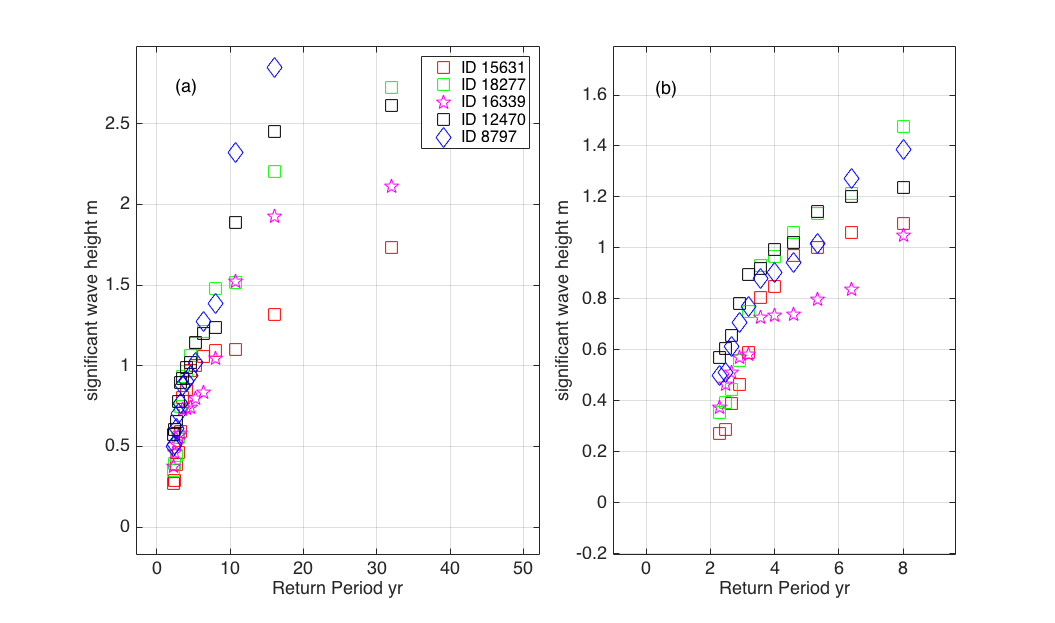
Model results at the coast can be placed in statistical perspective by looking at extreme values from different storms. This can help us estimate severe event probabilities.
For example, the Significant Wave Height – Return Period plot (graph below, left) shows the maximum wave heights at the five selected coastal locations plotted against a return period (in years). In this graph the most western location (ID 15631, red squares) shows the return period for significant wave heights of 1.72 m (5.6 ft) or larger is 32 years. In other words, the probability of a significant wave height exceeding 1.7 m (5.6 ft) any given year is 1/32. At the Eastern end (ID 8797) a 1.5 m (4.9 ft) significant wave height shows a 1/10 probability any given year.
For return periods shorter than 4 years (graph below, right) the modeled results collapse, showing less variability along the coastline. These results are driven by more common storms, ranging from a Nor’easter to weaker tropical systems moving up the Atlantic. For severe cases (Return Period > 10 yr) the western- eastern response show significant differences. Regarding the sea surface displacements associated with these storms (Graph b on the Gloria, Sandy, Irene, Nor’easter 2015 pages) results are more conclusive with the Western end of LIS always showing a larger amplitude in the response to the storm forcing (relative to the Eastern end)[1].
[1] Sea surface displacement is currently being fine tuned in our model by improving the open boundary conditions of our domain. The wave coupled hydrodynamic (FVCOM-SWAVE) in the LIS region will be forced with tidal predictions from the Northeast Coastal Ocean Forecast System (NECOFS).